

 ES
ES  FR
FR Publication | SCADA doesn’t lie! It’s how you read it that costs you
Your maintenance provider reports 97% availability. Your production is several points below the guaranteed power curve. Your captured price is below the day-ahead market average. These three findings do not contradict each other: they simply do not measure the same thing.
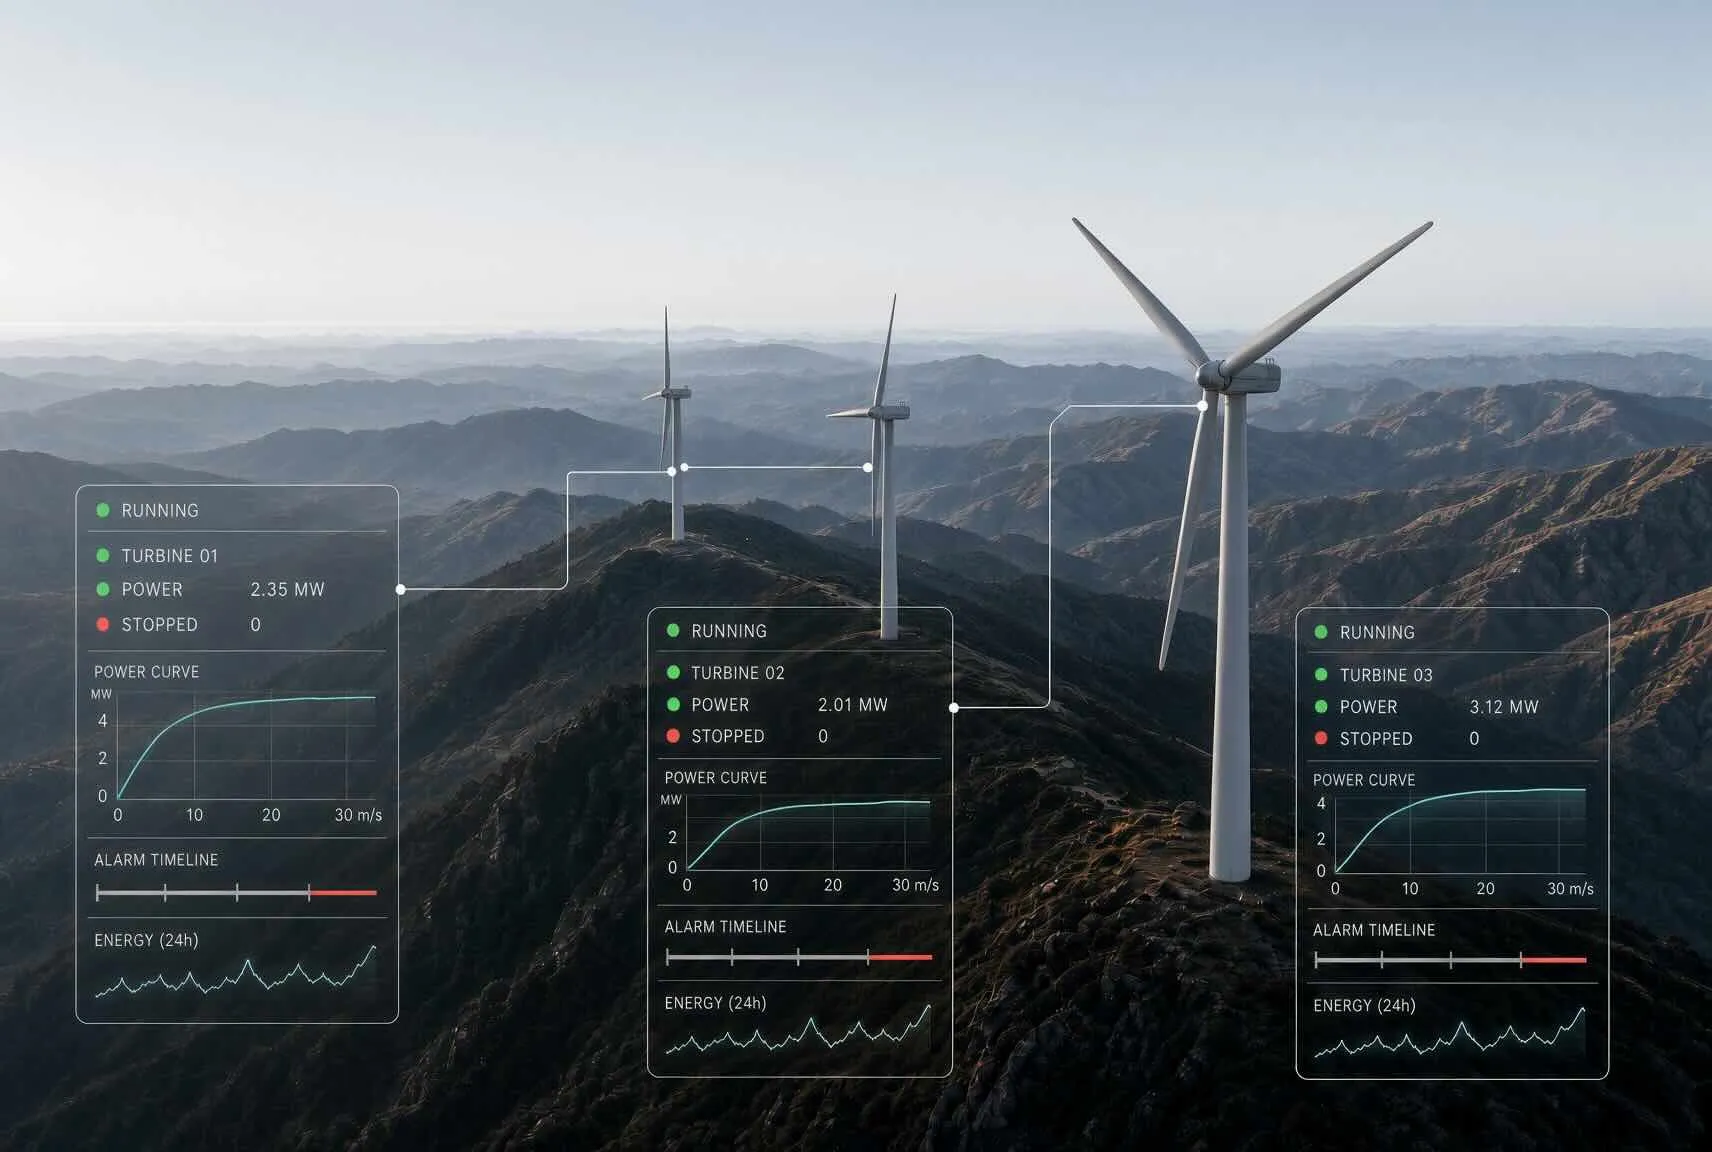
Yet a large part of the dialogue between owner, operator and maintenance contractor still hinges on a single figure, usually contractual availability. Vestas, Enercon, Siemens Gamesa, Nordex: the SCADA already provides the alarms, the turbine states, 10-minute production, nacelle wind speed, pitch and yaw angles.
The challenge is no longer having the data. The challenge is reading it in a way that links the families of losses that are too often mixed up.
The manufacturer KPI trap
Contractual availability answers a legal question: did the maintenance provider meet the agreed threshold, often 95% or 97%, once the stoppages excluded from the calculation have been removed (wind out of range, grid, force majeure, environmental curtailment, sometimes certain scheduled maintenance)?
It does not answer the operational question. A turbine can be “available” in the contractual sense and still produce well below its power curve. It can also be stopped by an alarm classified outside the maintenance provider’s responsibility, while the real cause is a component that has been drifting for months. Conversely, a long, well-documented stoppage weighs on the contractual KPI without being, in euros, the wind farm’s largest source of loss.
Three quantities must therefore remain distinct: contractual availability, the one in the maintenance provider’s monthly report; energy-based availability, which weights each hour of downtime by the wind actually lost; and the deviation from the power curve, which captures underperformance during the hours the turbine was running.
A wind farm can tick the first box and miss the other two. This is common on turbines more than ten years old, and it becomes costly as soon as the wind farm leaves its feed-in tariff.
Break stoppages down, don’t just count them
The number of alarms is a poor indicator. A yaw alarm that resets itself within a few minutes does not carry the same weight as an eighteen-hour converter stoppage during sustained wind. The right granularity is the triptych of frequency, duration and energy not produced, broken down by alarm code and then by component: pitch, yaw, hub, hydraulics, gearbox, generator, converter, cooling.
This breakdown changes the conversation with the maintenance provider. You no longer discuss an overall rate. You discuss a specific item. On many wind farms, a handful of codes explain most of the MWh lost. The rest is noise.
Yaw is a good example, because it often slips under the availability radar. A misaligned wind turbine is not necessarily stopped. It produces, so it is “available”, but mechanical power drops with the cosine of the misalignment angle. A deviation of around 10 to 15 degrees, observable by comparing wind direction and nacelle orientation, results in continuous underperformance that is invisible in the alarm report. The fault may come from a sensor, a poorly tuned control loop, insufficient lubrication or the ageing of the yaw drive train. It can be detected remotely, from the SCADA history, before any nacelle visit.
The same reasoning applies to pitch, oil temperatures or converter drift: it is not the alarm that costs money, it is the energy lost while it is active, plus the energy lost when the turbine is already running in a degraded state.
From lost MWh to uncaptured euros
As long as the wind farm is under a feed-in tariff, a lost MWh is worth roughly the tariff. Without support, or under a contract for difference exposed to the market, this no longer holds. Electricity is traded in blocks. Wind power produces according to the wind. The price actually received, the captured price, therefore differs from the average baseload price.
Across all French onshore wind, the captured price reached about €234/MWh in 2022, against an average baseload of around €276/MWh. In 2024, it had fallen back to €52.35/MWh, against €55.09/MWh baseload. Over the same period, some wind farms in the Rhône valley captured nearly €290/MWh in 2022 and more than €60/MWh in 2024, above the French day-ahead spot price. Wind profile, time of day and season matter as much as the price level.
The direct consequence: the same lost MWh is not worth the same at 2 p.m. and at 3 a.m., in January and in June, or on a valley site and on a plain site. A converter outage during an episode of strong wind and high prices can cost more than a week of off-peak stoppages. Conversely, producing at full power during negative prices destroys value: here, stopping is no longer a loss.
The technical manager therefore needs a fourth column next to the MWh: euros, hour by hour, cross-referenced with the spot price (EPEX in France and Germany, OMIE on the Iberian Peninsula). This cross-referencing is what makes it possible to prioritise a component, challenge an alarm classification, or reschedule planned maintenance.
What a technical manager can demand within thirty days, without changing SCADA
No new sensor and no replacement of the control system is needed. An alarm history, the turbine states, 10-minute production and wind data are enough for a first independent reading.
Four deliverables fit within a month. Reconstructed availability, month by month and turbine by turbine: data availability, contractual availability, total availability, with stoppages reclassified between maintenance provider, environment, grid and owner. Losses by alarm code and by component, in MWh then in euros. The deviation from the power curve during operating hours, isolated from downtime, with a focus on slow drifts (yaw, pitch, temperatures). The wind farm’s captured price, compared with baseload and, where useful, with the captured price of national wind power.
These four readings do not replace the SCADA. They prevent a contractual KPI from standing in for a diagnosis. Across a portfolio, two assets of the same technology can show the same reported rate and very different economic losses, depending on the wind, the alarm classification and the time at which the turbine stops.
Conclusion
SCADA records. It does not prioritise. Contractual availability protects a maintenance provider’s commitment. It tells you neither where the energy goes, nor what that energy would have been worth on the spot market.
Separating the three layers — contract, equipment, market — has become the minimum work of a technical manager as soon as the wind farm sells outside a feed-in tariff. The data is already there. What is missing is an independent reading, reproducible from one month to the next, and one that can be put to the contractor.
To go further
Wind availability audit, SCADA alarm analysis, power curve deviation, losses by component (yaw, pitch, converter) and captured spot price: WindDeep carries out this reading from the export you already have, without replacing the SCADA.
Three studies, at wind farm or portfolio level. The availability audit reconstructs contractual and energy-based availability, and allows stoppages to be reclassified with the maintenance provider. The performance audit isolates turbine underperformance, alarm codes and failure risk. The spot economic analysis measures captured revenue, the gap with EPEX or OMIE baseload, and values the lost MWh in euros.
The same indicators can then be monitored in WinDATA and WinDEEP. An alarm file and 10-minute production data are enough for a first diagnosis.
@2026 Winddeep. All rights reserved.
 Phone us
  Chat with us
 Submit a custom request